
Based on the information entered, check the results of the collision risk analysis. After clicking on the robot that has completed the analysis on the 3D screen, click the Analysis button at the top, and the analysis result screen will appear as follows.
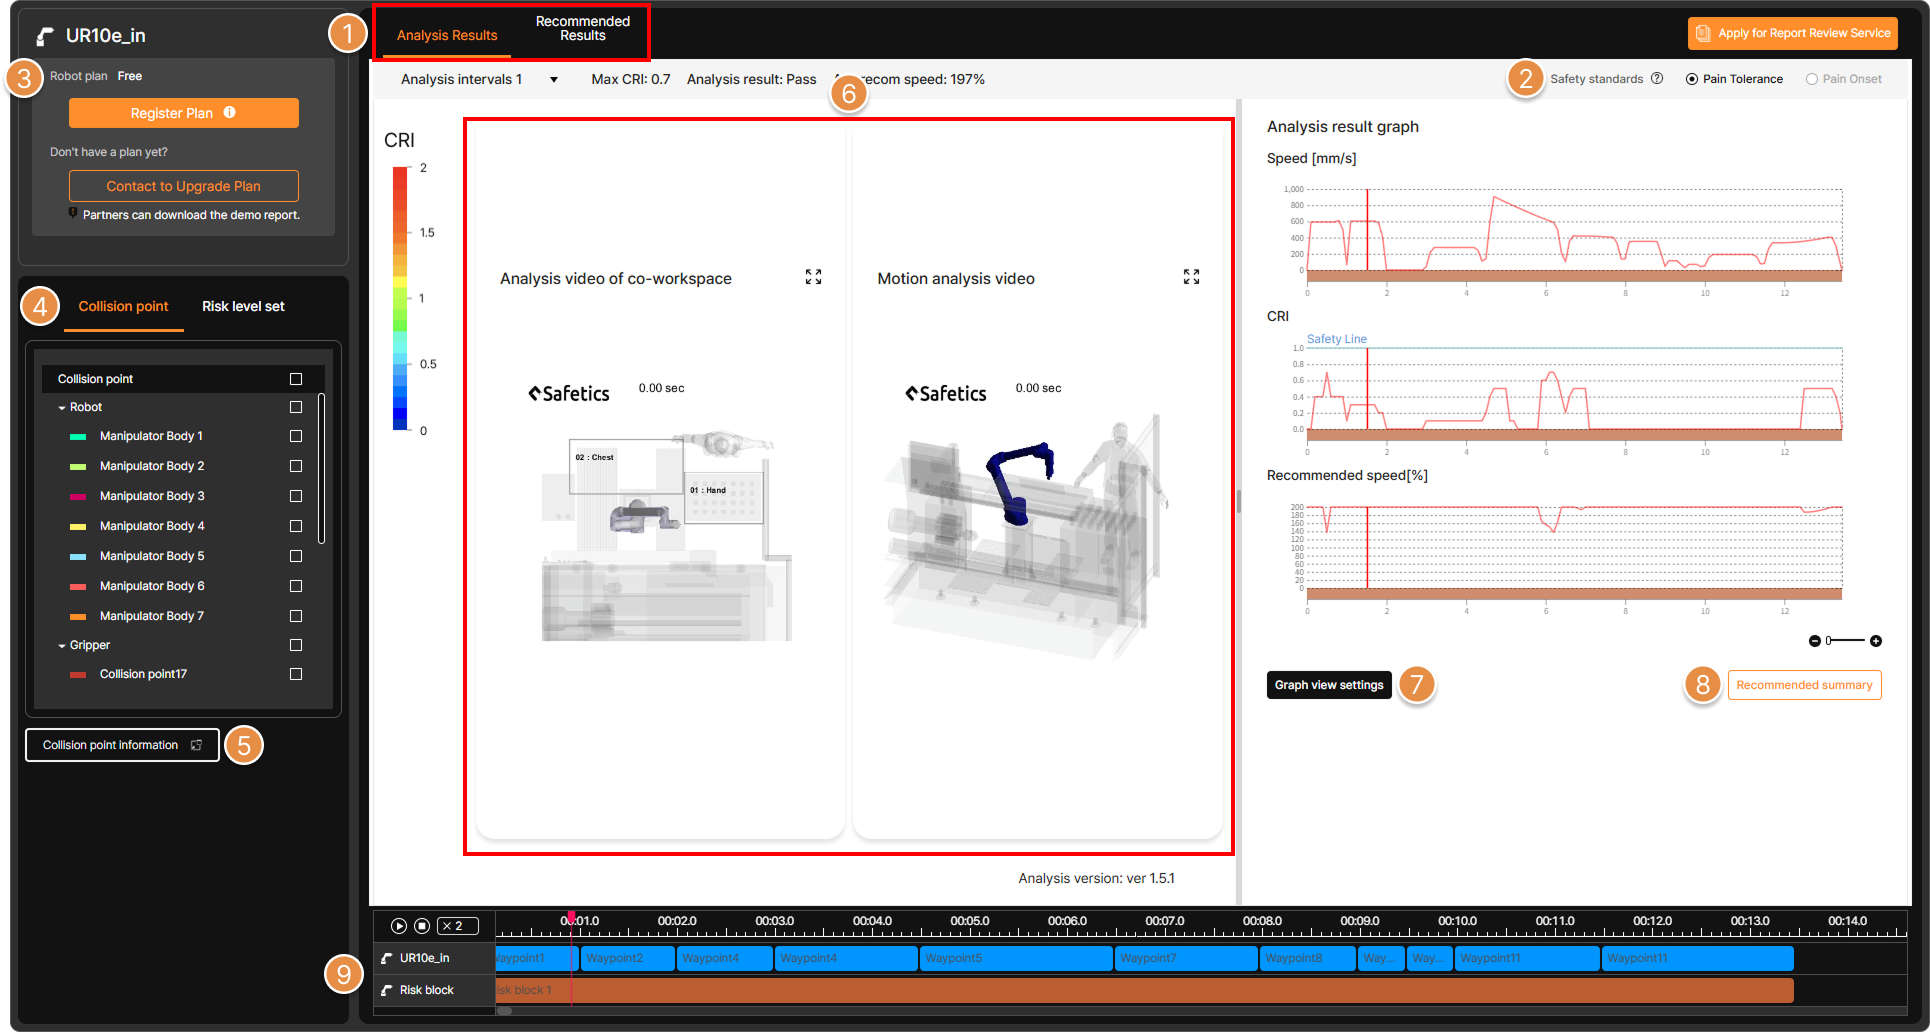
① Analysis Results / Recommended Results
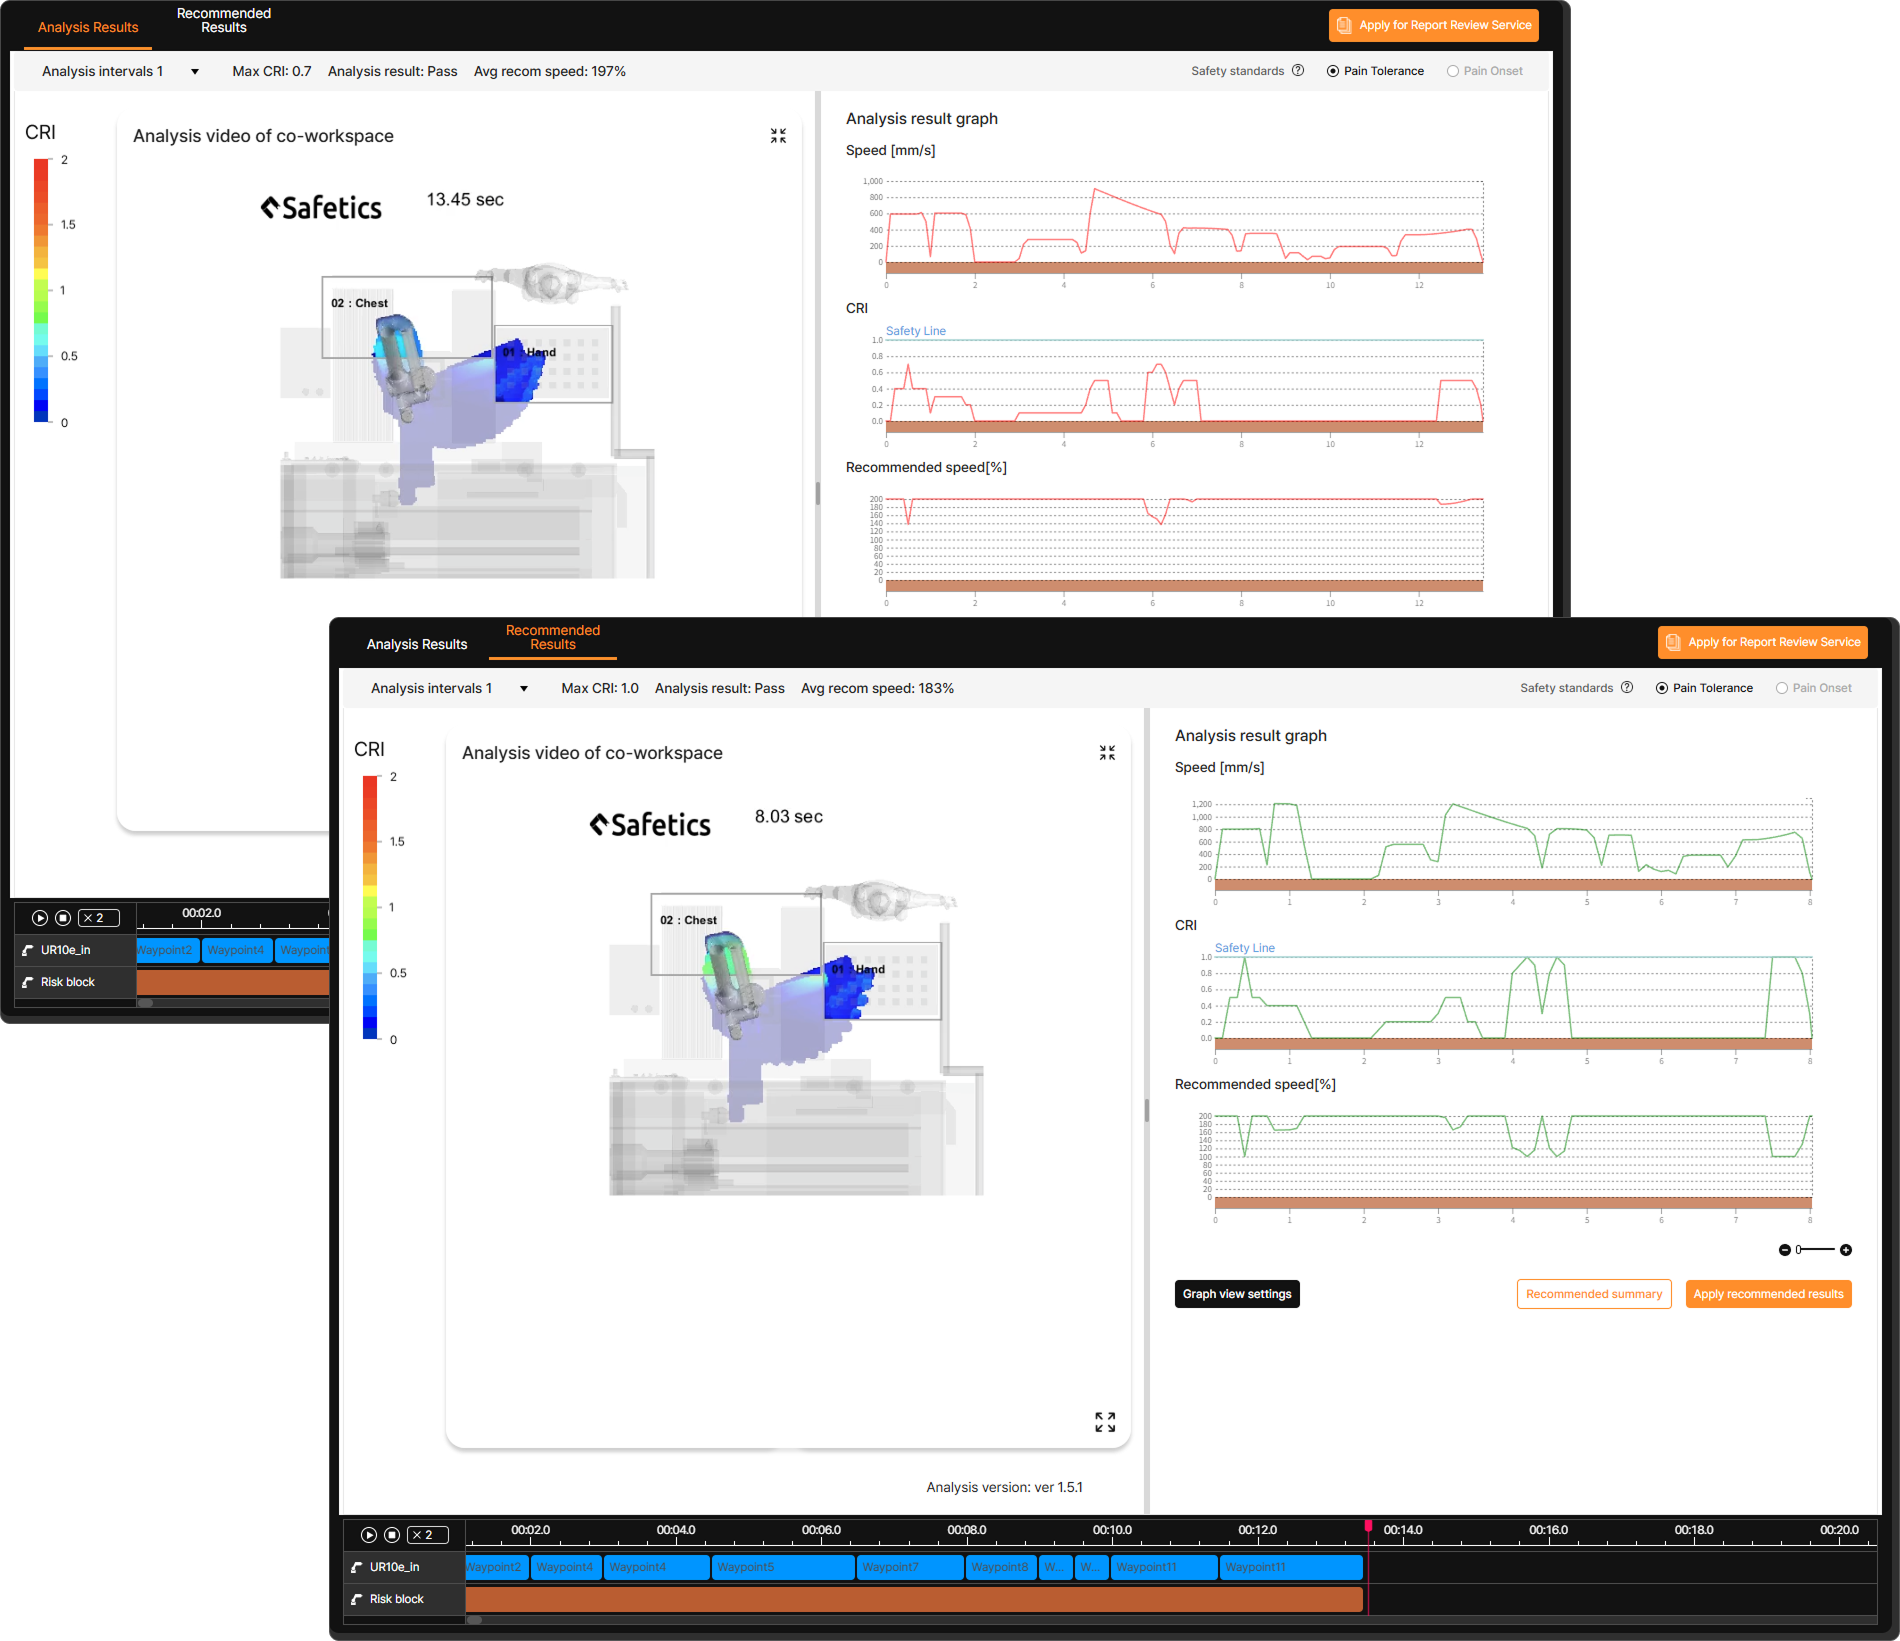
If the Safety Analysis Recommendation feature is selected in the analysis option, both the Analysis Results tab and the Safety Analysis Recommendation Results tab are displayed. This allows for alternating views to check the analysis results before and after applying safety analysis recommendations.
The top of the analysis screen displays the analysis Pass/Fail status, Max CRI, and average recommended speed.
 SafetyDesigner compares the analysis results to standard tolerances and expresses them as Collision Risk Index (CRI) per collision point.
If the CRI value exceeds 1, the analysis result is marked as a fail, and it is a pass if the CRI values is less than 1.
For points where the CRI value exceeds 1, SafetyDesigner shows on graph how much the speed should be reduced to bring the CRI value below 1.
② Safety standards
Review the analysis results for each standard. If the Safety Analysis Recommendation feature is applied, analysis can only be performed for one standard.
③ Robot plan
Check the plan status (Free / Partner / Premium) of the robot selected for analysis. If a SafetyDesigner usage contract exists for the account or the group to which the account belongs, a paid plan can be assigned to the robot to output the Collision Risk Analysis Report.
If no usage contract exists, contact a sales representative by clicking the Contact to Upgrade Plan button.
For more details, refer to Collision Risk Analysis Report issuance.
④ Collision point / Risk level set
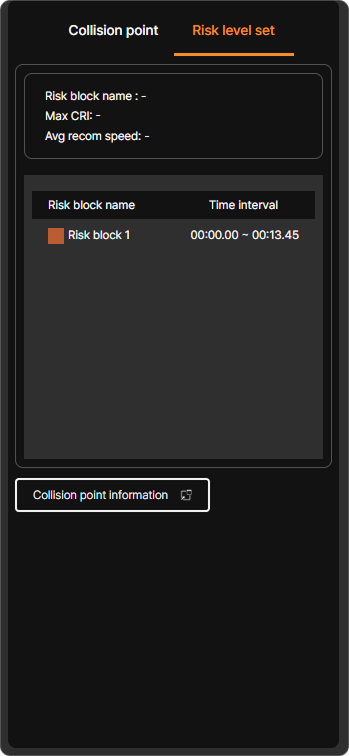
In the Collision Point tab, the collision point of the gripper and workpiece set during analysis information input, and the robot’s collision points, can be viewed. The Risk level set tab displays a list of risk blocks set during motion split.
Clicking a checkbox or selecting a risk block highlights the graph for the corresponding collision point or risk block on the Analysis Results Graph on the right side of the screen.
For more details, refer to What is Motion Split?.
⑤ Collision point information
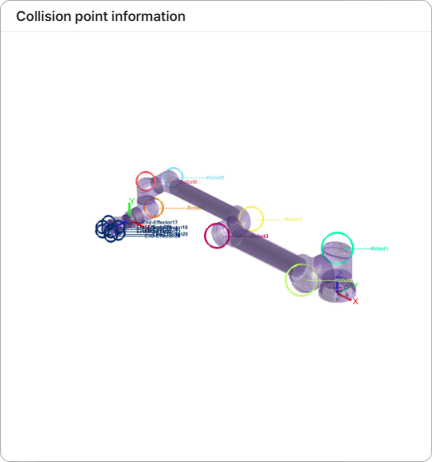
Information on collision points can be viewed with images.
⑥ Analysis Videos
Play and review the analysis videos. Available videos include the Collaborative Workspace Analysis Video, which visually represents potential risks for each collaborative workspace, and the Motion Analysis Video, which shows the entire layout in a 3D Isometric View.
⑦ Graph view settings
Information displayed on the graph can be selectively turned on or off.
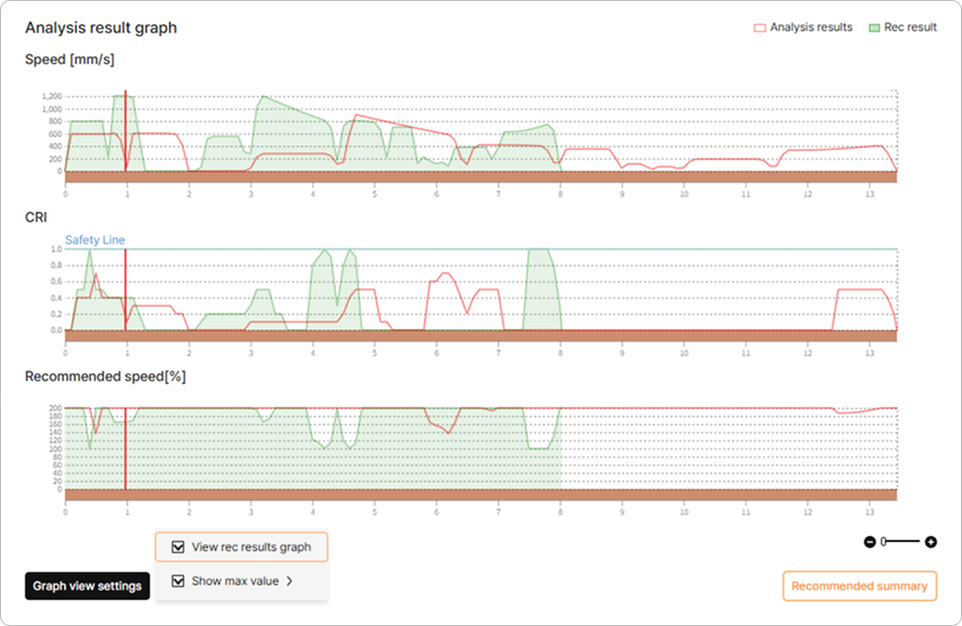
Checking the View rec results graph option displays both the analysis results and the safety analysis recommendation results together for easy comparison.
⑧ Recommended summary
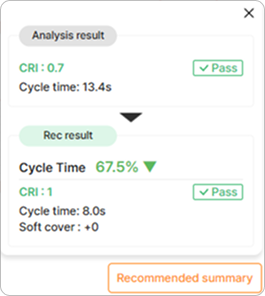
Review the summary of analysis results and the results from the Safety Analysis Recommendation feature.
⑨ Timeline UI
Controls playback functions for the analysis video, such as play, pause, stop, and seek.